Written by Steven Woo for Rambus Press
In part two of this series, we took a closer look at how the upcoming deployment of 5G technology will enable processing at the edge, and how the industry is further refining the edge into the near edge and the far edge. The near edge is closer to the cloud, while the far edge is closer to the endpoints. As we noted, we expect to see a full range of AI solutions spanning the near and far edge. Specifically, at the near edge, closest to the cloud, AI solutions and memory systems will likely resemble what is seen in cloud data centers including on-chip memory, HBM and GDDR. At the far edge, AI memory solutions will likely be similar to those deployed in endpoint devices, including on-chip memory, LPDDR, and perhaps even DDR.

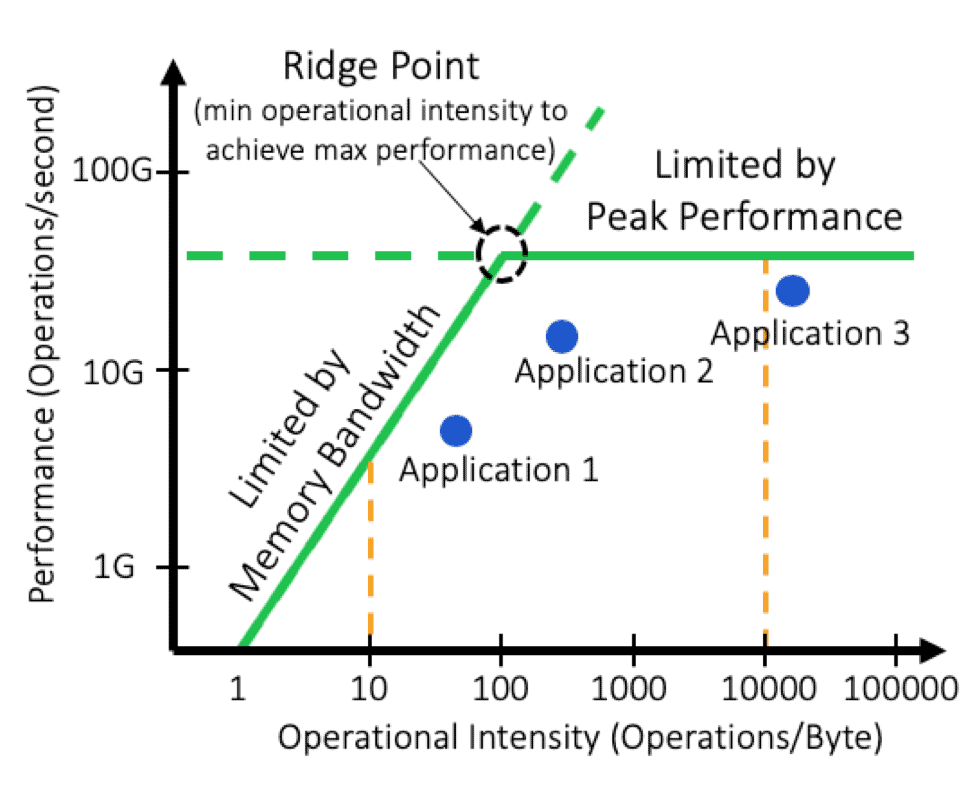
In this blog post, we’ll explore how to determine if specific AI architectures are limited by either their compute performance or memory bandwidth by introducing the Roofline model. Put simply, the Roofline model illustrates how an application performs on a given processor architecture by plotting performance (operations per second) on the y-axis against the amount of data reuse (also called “operational intensity”) on the x-axis.
The operational intensity of an application on a particular processor is a measure of how many times each piece of data is reused for computations once it’s retrieved from the memory system. If an application has a high operational intensity, it means that that data is reused many, many times in various calculations once it’s retrieved from the memory system. Applications with high operational intensity put less stress on the memory system, because data can be reused often. In contrast, applications with low operational intensity can be bottlenecked by the memory systems of the processors they are running on, because they demand much more memory bandwidth to achieve high performance.
The Roofline is composed of two different line segments and is unique for each processor architecture. The first segment is a horizontal line which represents the peak performance of the processors. If every compute unit is running continuously at full speed, this is a measure of the peak performance that you can’t exceed. The other part of the Roofline is a slanted part of the line which shows when the architecture is limited by the amount of memory bandwidth that you can provide. If there isn’t enough memory bandwidth provided by the processor, then the architecture may be bottlenecked, preventing the compute units from running at peak performance as they wait for data from the memory system. As you can see in the image above, the Roofline itself is colored in solid green and is composed from a portion of the sloped line, as well as a part of the horizontal line.
Each processor architecture has its own Roofline model, because each has different peak compute performance and memory system bandwidths that they can provide. We can plot different applications against a Roofline curve to gain a better understanding for a specific architecture whether that application is limited more by memory bandwidth – or limited more by the peak compute performance of the processor. In this particular chart, application number one lies more underneath the slanted part of the line. This means the operational intensity, or the number of times each piece of data is reused in that application, is low enough that we can’t achieve peak performance. If more bandwidth was provided, we could move closer to peak performance (the horizontal part of the Roofline).
On the right is application number three, which lies underneath the flat part of the curve. This means application number three has enough memory bandwidth – and is limited more by available compute resources in that processor. If we had more compute resources (for example, more adders and multipliers) or could run them faster, then we could potentially achieve a higher level of performance.
Application number two is near where both the horizontal and sloped parts of the Roofline meet. This means that this application is partially limited by the peak performance of the computational resources of the processor and partially limited by memory bandwidth. Application two could benefit if additional computational resources and memory bandwidth became available.
On final point should be made about Roofline. The corner in the Roofline image above is known as the ridge point. This represents the minimum amount of reuse – the minimum operational intensity needed to achieve the maximum processor performance. This is an important point, because it helps us understand how algorithms can be arranged to achieve peak performance for applications.


Leave a Reply